prtg

PRTG sensor to monitor a directory for a specific file type and minimum size and age

The following script will monitor a specific directory for a file of a defined type and minimum size, it will report back to you the newest file of the specified type and over the minimum size and provide you the file age and size to PRTG.

The name of the file will also be reported back as a text value for the sensor in PRTG.

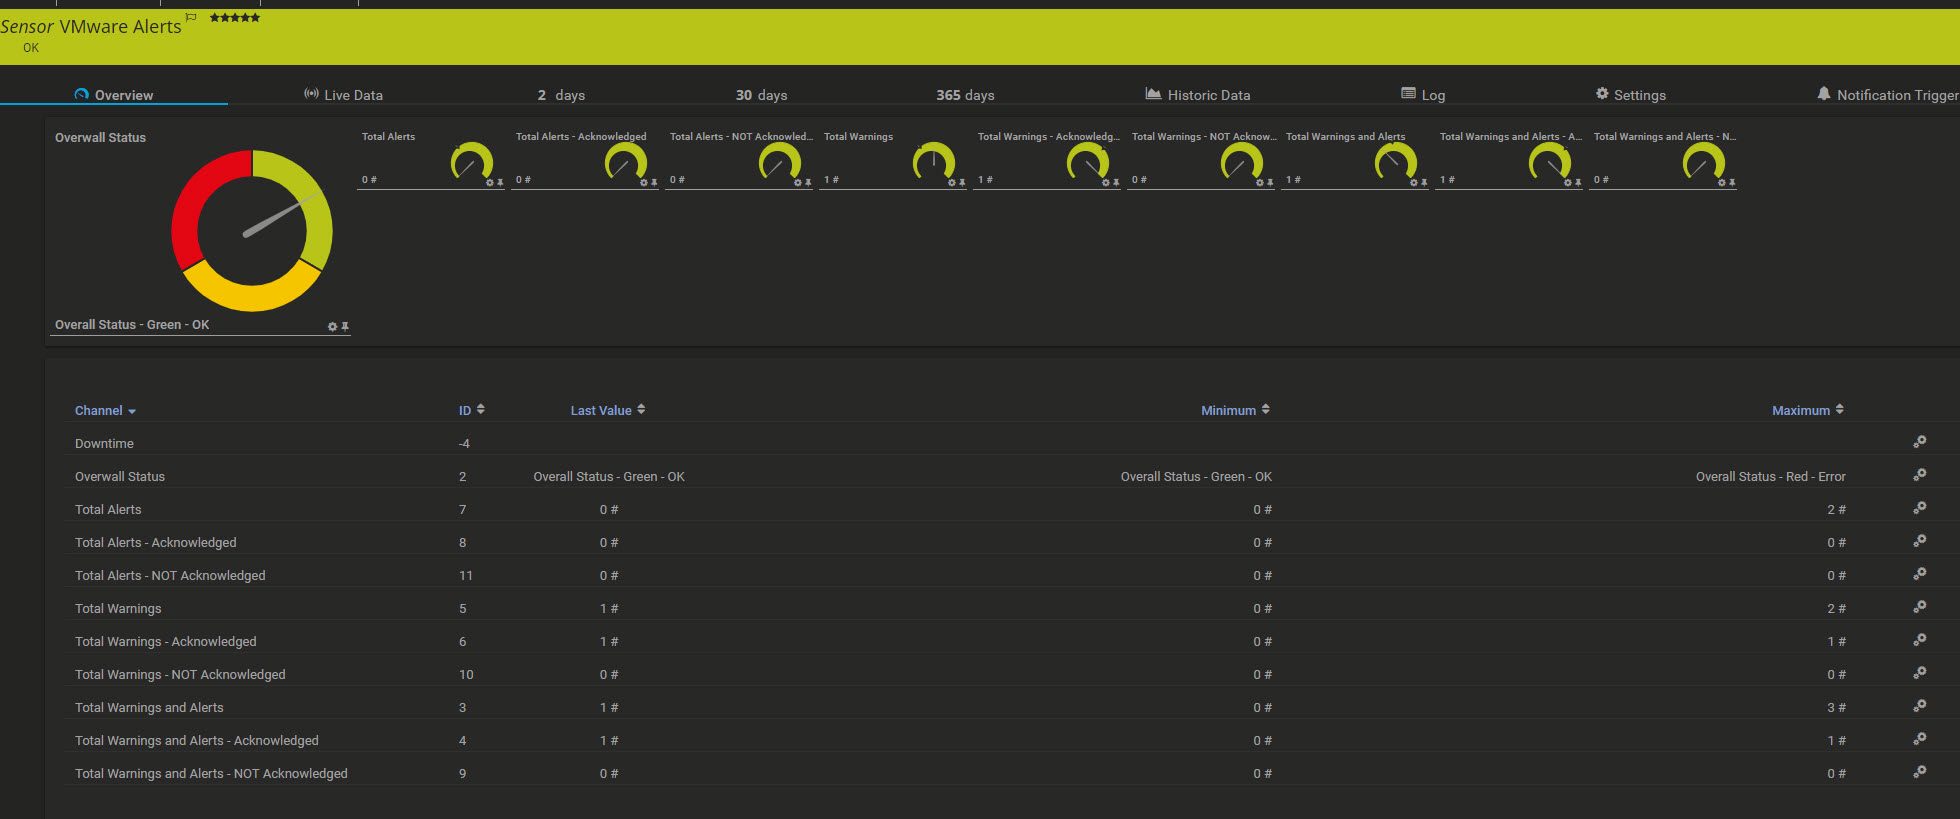
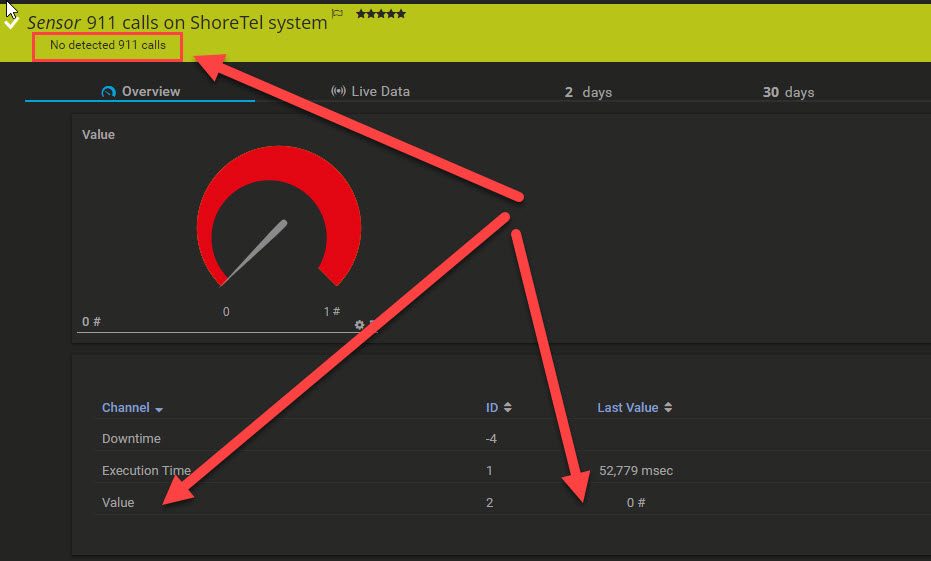
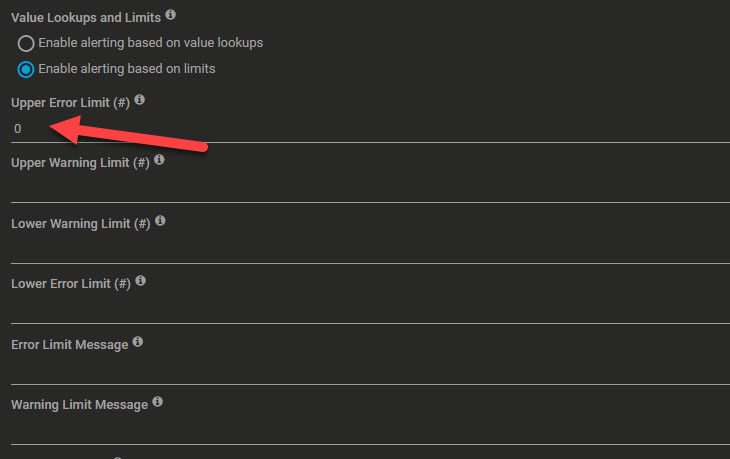
If the script encounters any errors, the total files value will be 0 for no files found or -1 for a script error. Therefor please set minimum channel error values accordingly to get alerted.

The goal here is to get the age of the file back that was found, to make sure the file is not older than expected. This is needed for some automated exports or data transfer files, this was you can be sure that your export routines work as expected.

APC NetBotz 250 SNMP monitoring with PRTG

If you want to monitor an APC NetBotz 250 series device for environment monitoring in PRTG, you soon find out that there is no real MIB/OID file respective SNMP reference. APC mentions you can use the regular SNMP network card MIBs, but they only work so far.

The current model of the APC NetBotz 250 comes with an additional wireless temperature monitor, a little device that works with an independent little battery that you will need to exchange every 3 years (estimate).

This sample assumes you will have the following configuration – if not please do a SNMP walk to find out what sensor delivers data where.

  • Wired Sensor 1: Temperature and Humidity probe
  • Wired Sensor 2: Fluid detection probe
  • Wireless Sensor 1: Temperature probe

Add a new SNMP Advanced Sensor to PRTG and name it “RAW data”. This sensor will read the via SNMP from the APC device, we will then further process the data.

  • Channel 1
    • 1.3.6.1.4.1.318.1.1.10.4.2.3.1.9.0.1
    • Sensor 1 – Temperature
  • Channel 2
    • 1.3.6.1.4.1.318.1.1.10.4.2.3.1.6.0.1
    • Sensor 1 – Humidity
  • Channel 3
    • 1.3.6.1.4.1.318.1.1.10.3.20.6.1.4.2
    • Sensor 2 – Fluids
  • Channel 4
    • 1.3.6.1.4.1.318.1.1.10.5.1.1.1.5.1
    • Wireless Sensor 1 – Temperature

After creating this sensor, note the Sensor ID from the URL.

Now add another new PRTG Sensor of the type “Factory Sensor”. This is a special sensor that can process data from one or more other sensors and channels and apply formulas etc.

In the channel definition add the following text

  • 1:Sensor 1 – Temperature[°C]
  • channel(2779,2)/10
  • 2:Sensor 1 – Humidity[%]
  • channel(2779,3)
  • 3:Sensor 2 – Fluid Detection
  • channel(2779,4)
  • 4:Sensor 4 – Wireless Temperature[°C]
  • channel(2779,5)/10

Replace the Sensor ID 2779 with the Sensor ID of your RAW data sensor that you noted earlier, no worries, you can do that as well after you created the probe.

This sensor now shows you more readable data. The temperature from SNMP will be provided in degree Celcius to the tenth, meaning 28.3 C come back raw as 283, the factory sensor corrects this to the 28.3 C.

To get Fahrenheit you need to adjust the channels like this:

  • 1:Sensor 1 – Temperature[°F]
  • ((channel(2779,2)/10)*1.8)+32
  • 2:Sensor 1 – Humidity[%]
  • channel(2779,3)
  • 3:Sensor 2 – Fluid Detection
  • channel(2779,4)
  • 4:Sensor 4 – Wireless Temperature[°F]
  • ((channel(2779,5)/10)*1.8)+32

Eventually it is Celsius times 1.8 plus 32 to get the value in Fahrenheit.

To get alerts, adjust each of the four channel to limits based on their values. For temp and humidity choose ranges that apply to your environment.

As for the Fluid detection, the upper and lower error limit should be 2, as 2 is the only non alert value for this sensor. If fluid is detected, you should get the value 1 back, easy to test with some water and your sensor.

Auditing network users against HR lists etc.

Auditing network users against HR lists etc.

Auditing network users against HR lists – a topic that is often overlooked or causes some headache due to e.g. name variations, while it is so important to make sure that your Active Directory is a clean and up to date as possible.

There are big paid solutions out there, but unless you have the budget, resources and processes in place, you will need a simpler approach. Having worked in various sized businesses, let me make some suggestions here. Keep in mind, not all of it might be applicable or best for you, but I hope it will at least provide you some ideas and help to improve your network security.

Structured groups and rights

Before we begin – you should always make any effort to have a very well structured rights base. Avoid cross use of e.g. groups for mail distribution and NTFS file system access. It seems like a good idea until someone needs access to the NTFS path and boom he/she receives the group based communication as well. This is of course just one example. Structure your file systems and right assignments well. All of it can make all the difference. Don’t complicate things, keep it simple.

Monitoring Active Directory activity

What you want is something that constantly looks for any changes to Active Directory, at a bare minimum new users and deleted users as well as group-membership changes. There is some software out there to do this, some is free, often with limited functionality, some you need to buy. Personally I was working on a Windows Service to monitor Active Directory changes, but my time is limited and to this day I did not finish it. Having said this, the IT-Asset Management Database on this website actually has a module that does just this, it monitors the most important activities while it does actually a compare of gathered SQL data against current Active Directory information and eventually sends you a daily report about changes.

Such reports might not be perfect, as they don’t real-time monitor such activity, rather then only send you daily summary reports. Paessler PRTG in combination with either some default sensors or custom scripts like Group Membership change and password reset monitoring or the more specific script for group-membership monitoring are more then helpful. Monitor especially e.g. Domain Admins groups and other groups that would allow access to sensitive areas and data of your network. Such active alerts due to a network monitoring solutions might give you the chance to act fast.

Auditing your user base against HR (Human Resources) data

Again, there is software and solutions out there that can do this automatically or help you with your efforts. But often HR is simply using their Payroll platforms and depending on what they have, it won’t have the functionality you need or they are reluctant to implement such processes or possibly provide you access after all.

The main issue I came across is that there is a difference between the HR data and what the full name in your Active Directory (e.g.) is. You can’t further not just automate user name prediction based on any HR export data you have, cause there likely will be duplicate names as well, depending on how you create user names.

HR normally has an employee number, they should be able to provide this in any employee export to you. Now, Active Directory has actually some attributes that you easily can engage: EmployeeID, employeeNumber and employeeType. PowerShell is your friend, if you want to set them. I highly recommend to use PowerShell to some extend if you create new users. Look at the CheckLists in combination with employees in the IT-Asset Management Database as well for some hints and automation. Microsoft’s Set-ADUser PowerShell command will be helpful as well.

Eventually use a tool like the IT-Admins tool to read your users from your Active Directory and export to Excel. Once you have this, you compare the HR list against the Active Directory export. Don’t bother with VLOOKUP – research the use of INDEX/MATCH in Excel. Format both tables as tables in Excel and document your process, as this might depend a bit on what tools you engaged and how the eventual data looks like. You should end up comparing the HR employee number against the HR employee number stored and exported from Active Directory. This should give you a quick and clean overview. What you should be on the lookout for are those N/A error in Excel in the compare column, as well as possibly HR data that indicates a termination or change. You can go as far as compare the department information, again there are Active Directory attributes for this as well. Department names and department IDs.

If you want to go another step, start comparing group-membership as well. Export all the groups and members, again the IT-Admins Tool can help you here. View it possibly from both sides, the group and members view as well as user is member of groups view. Have the department owners take a look at it as well, they might want to see this.

And step three will be an NTFS rights review. Never ever should there be a user account directly used to assign rights in NTFS. This always should be done via groups. How ever, to review this I again recommend using the IT-Admins Tool, as this is actually designed to help you with the process and is able to export the needed data rather quick and simple.

Don’t forget your ERP systems and systems with Active Directory independent user bases

It is not always possible to rely on Active Directory as only source for your user base. Even if you can, the right assignment in e.g. your ERP system to functions likely is independent from Active Directory. Look in to any possibility of your ERP, either API’s or possibly dig in to the database (or where ever the data is stored), to find out about right changes (groups) and review those lists as well against HR information periodically.

Office 365

Oh – it is synchronized with Active Directory, right? Well – review it anyways. There might be a user object that is not synchronized and exists only in Office 365, groups as well. Review the rights to access certain administrative areas within Office 365.

You should definitive review third party users – especially Microsoft TEAMS and sharing e.g. SharePoint or OneDrive files and folders with outside of the organization will likely create some guest accounts. Keep an eye on those.

And then the third party applications – you need to keep an eye on those, as they can cause possible harm or gain access to sensible data. Users/Employees often will install them without reviewing them thoroughly, or they simply don’t realize they might have been there and share confidential data.

Account breach / compromise and API keys in Office 365 should also be something you want to keep a good eye on. Clicking on the wrong link (it will happen!), entering the password and it is to late. Don’t think a simple password reset will solve the issue. Don’t only rely on your MFA. Review does API keys especially in Office 365. What can happen is that the password is used right away to install an API based access to Office 365 that will then independently from password changes have access to the data. Keep an eye on those things as well!


Monitoring relative printer page counts with PRTG

Monitoring relative printer page counts with PRTG

PRTG has many standard sensors, but one I was always missing is a daily page count compare. The standard printer sensor gives you a total page count – but this to some extend will always be a graph that only will go up. You can only estimate the total page counts in those graphs.

If you ever looked in to the IT Assets database project, you will see that in the Printers area there is a possibility to enable detailed graphs for relative page counts.

Why is this important you might wonder. The answer is simple, as an IT Manager you need to know if a certain kind of a printer makes sense at a certain location. If you have a low end printer for only casual print-outs but you have a total over e.g. 10,000 pages printed every month, you might need to reconsider the printer model. The reasons would likely be:

  • higher cost per page
    • constant toner exchange of a compared more expensive toner cartridge
  • maintenance cost
    • you might need to constantly maintenance the printer
    • the cost for the maintenance kit are relatively high
  • downtime issues
    • due to toner empty
    • printer needs maintenance again
    • less pages in paper tray

On the other hand, a printer might also be overkill for a certain area and not be cost efficient. Those conditions also might change over time of course. Further is there often the question – is a single area printer (copier) better or multiple smaller printers. This of course can go pretty far and you want to consider Lean processes, Six Sigma guidelines and others along with this data.

How ever, I started a first draft of a script that provides me at least the total page count relative to each day in PRTG. This sure is not as efficient yet as I do this in the IT Assets database printer module, where I collect data e.g. every 30 minutes in a huge table and then later calculate all the data in a daily range respective monthly range while collecting total page counts and possibly counts per copy vs. print outs and additionally color vs. black and white print. But at least it is a start.

Below you find the first draft of this script.

One thing to know – you will need to run the following command in order to install the PowerShell SNMP module on your PRTG probing server:

The current version of the PRTG script:

PRTG and Cisco ASA VPN monitoring

PRTG and Cisco ASA VPN monitoring

The default PRTG sensor for VPN connections on a Cisco ASA has a limited of 50 users connected, actually less. This is due to the limit of 50 channels per sensor.

These days IT departments everywhere likely exceed 50 VPN users everywhere.

Since I do not need to know who is connected, rather then the amount and load on the FW, I came up with a simple sensor and MAP in PRTG to show me the essentials.

Add a snmp custom sensor to your FW in PRTG and use the OID

  • 1.3.6.1.4.1.9.9.392.1.3.1.0

This will give you a number of VPN connection. I am not 100% certain about the OID only being used for Cisco AnyConnect or other VPNs as well. I found it as a valid SNMP OID as I only use Cisco AnyConnect and my VPN tunnels aligned with this number.

Further did I add sensors for CPU / RAM and on the external interface of the FW to the map in PRTG to see the overall status and load.

Detailed information on the bandwidth are a different story, since this is more a passive point in time configuration, I don’t pull that in this map – I care about an average load picture not single pikes that only are temporarily. For this I have different approaches and sources. Mentioning this only for the big picture and cause you need to be aware of that.

Hope some find this helpful.

If you want the users that are online and offline – what is actually a big of a questionable thing due to data privacy concerns and a user not always needing to be on VPN in order to do work – you could create scrips to access more detailed SNMP data and balance this in various sensors. This is possible, but I do not recommend it. Another approach would be using the TEXT value in XML sensors and put the info there. Still, I think you might get to much data and need to ask yourself if this is even something you should collect/monitor.

Here a picture of my map as we barely started getting more home office people online.

PRTG Cisco ASA VPN users

PRTG Cisco ASA VPN users

Backlink to the Paessler PRTG KB, where this was discussed as well: https://kb.paessler.com/en/topic/64053-my-snmp-cisco-asa-vpn-users-sensor-shows-a-user-limit-error-why-what-can-i-do

PRTG and VMware 6.7 vCenter host hardware status

PRTG and VMware 6.7 vCenter host hardware status

The following script was created to bypass an issue in the SOAP API in relation with VMware, hardware vendor drivers and PRTG. In any case, you could use the same script for other monitoring systems or any other purpose – of course while adjusting it to your needs.

You can find more information about the issue here: https://kb.paessler.com/en/topic/82458-vmware-host-hardware-status-soap-sensor-returns-warnings-after-update-to-vmware-6-7

In order to make this work you need to install the VMware PowerCLI PowerShell extension on the PRTG probe server. Further will you need to inject username and password as well as the vCenter name and internal hostname in vCenter.

LDAP authentication activated targets:

  • $host %host “%windowsdomain\%windowsuser” “%windowspassword”
  • $host %host.domain.local “%windowsdomain\%windowsuser” “%windowspassword”

Otherwise – you might need to use this format:

  • $host %host root MyRootPW

Test it in PowerShell as the Probe-User first – you should see the results. Eventually the script create a sensor with multiple channels – sensors in GREEN status will be counted only – sensors in UNKNOWN status will be counted and returned as text, while as long as no YELLOW or RED status (warning or error) occurs, the sensor still stays green/okay. Warning or Error levels will automatically apply and have the problematic hardware systems in the sensor message text.

My first attempt was to show all channels on top of the summary – due to getting over 100 separate hardware statuses back and the limitation in PRTG of 50 channels per sensor, I dropped the idea – while the script still has all the code to handle it.


APC InRow A/C error monitoring with PRTG

APC InRow A/C error monitoring with PRTG

It is rather hard to get valuable alarm monitoring from an APC InRow air conditioning unit. The APC A/C’s are a real pain when it comes to this, it might even be that this same principle applies to APC UPS units, but I did not have yet time to test this out.

What I really wanted is a way to monitor alerts that the unit reports. Doing so seemed to be fine with a simple SNMP sensor in PRTG but the real challenge was getting the alert text. Now, there are SNMP channels but they are only available when an alert is ongoing, meaning when there is no alert status the whole OID fails.

To compensate this, I ended up writing a simple PowerShell script that interprets the SNMP OID results, even ignores a certain failure cause I didn’t care about it, and reports back the results as a total error count (set the channel to ErrorLimit = 0 in PRTG) and if there are Errors it will write them to the text.

This is an Advanced EXE script that needs to reside in the following path:

It expects the parameters for community and IP-Address

The results of the script will always hold the top 4 error messages, but it will exclude the phrase “No Backup Units Available Alarm” from the error count – cause in certain setups like hours there are multiple units but they are not necessarily clustered – this is not a full alarm rather then a warning in my case. Feel free to adjust this in the script if you want to raise the error. You could simply remove / remark the following line:

Here a picture of a real world alarm respective issue with the APC InRow A/C in PRTG generated by the script

Summarize SQL server database file size information as a single row

Summarize SQL server database file size information as a single row

The SQL script below will show you the summarized database file size and database log file sizes on the current database. This can be helpful to monitor the actual file sizes in a single row / line.

This script was also posted in the Paessler PRTG KB, where the initial request for this came up. Posting it here cause I think it can become useful for some. The initial code used and modified is from Tri Effendi SS of stack exchange.

You will need to adjust the USE statement in the first line to the database you want to gather the information from.


Compare a TRACEROUTE against an expected route

Compare a TRACEROUTE against an expected route

Some times it is important to know if a route to a specific target changed. The best way to check this is for sure to engage a monitoring software. But there might not be a real standard solution in the monitoring software. Now you end up wondering how should you approach this and find a solution to monitor a traceroute result and the hops between you and the target and find out if something changed.

For this exact case I wrote a PowerShell script that expects the following two parameter:

  1. a target IP address or DNS name
  2. a list of IP addresses in order as they should come up in the traceroute (comma separated)
    1. include the target IP address as a final HOP

The script then will execute a tracert or traceroute to the target and compare the results step by step against the IP address list you injected. If a HOP is different at a certain position from what was expected an error will be reported back which IP was found and which was expected.

If there are no differences as for the injected IP list, it still could be the case that the traceroute to the target was e.g. longer or shorter – if there then is a difference in the HOP count between the actual traceroute results and the injected IP address list you still will get an error raised and a report back on the amount of found hops and expected hops.

Since the whole output is optimized to be processed by Paessler’s PRTG you also get an error from the sensor / script when the target was not reachable.

Additionally some information on the round-trip-time (RTT) and total HOPs is reported back to the sensor, ending up in a total of four channels:

  1. Target reached
  2. Round Trip Time
  3. Total HOPs
  4. Route matches expected route

As of September 2020 there are two versions of this script. First see the original script, after this I detail out the second version, see further below please.

As mentioned further above, after a request in September 2020 in the Paessler KB a version 2 of the script was created. This version includes a third needed parameter – Expected IP address. This also introduces a new channel, that will indicate if the expected IP was found or not (error status).

This can possibly help, as the requestor stated, to determine if route still goes over a primary gateway or a backup gateway. Sometimes you a route might change further below, but a certain router needs to be active. You could also easily change the expected IP behavior to not expected IP behavior, by changing the $ExpectedIPFound value in line 33 to 1 and in line 36 to 0. This will invert the script behavior for this function and therefor only alert (indicate) IF this IP suddenly appears on the route, besides the fact that the route will have changed anyways.

Request a DNS based web site directly from an IP address

Request a DNS based web site directly from an IP address

If you are using multiple web servers and some more advanced DNS configuration like e.g. Round-Robin (and other) to load balance and possibly even GEO divide traffic to those web servers while those are all hosting the same web site you might as well want to monitor if this is all working as expected.

The challenge in this case is – your monitoring system might get just a single IP that might even change every now and then back from DNS when it requests it from DNS. So you would end up needing to use the target IP addresses of the individual web servers instead. But those expect you that your request for the web site goes through the domain name, since the servers aren’t supposed to answer on direct host-name / IP address requests or another web-site might be hosted there.

In order to accomplish this – I wrote the script below. It allows you to request a website directly from an IP address while injecting the DNS host in the header section of the Invoke-WebRequest (IWR) in PowerShell.

If you need to target a specific target site you can inject of just the IP address additional information, for example:

  • Standard parameters
    • -DomainName “google.com” -IP “8.8.8.8”
      • this will request the web-root / default page
  • Sub-Page parameters
    • -DomainName “google.com” -IP “8.8.8.8/monitoring.html”
      • this will request the content of /monitoring.html on the IP 8.8.8.8 with the DNS name google.com

PS: Please be aware – the above will not work – 8.8.8.8 is a Google-DNS server and not one of their web-servers. The above is only an example to show what is possible.

The below script output was optimized to be used in PRTG.


Using PRTG to monitor manufacturing machines

ns a website from a systems administrator for systems administrators Home IT-Admins CMDB IT-Admins tool IT Search EOL Solutions Blog Contact Links Using PRTG to monitor manufacturing machines

This is a screenshot of the real-time data map of the PRTG instance that is used to monitor the data collected by the Raspberry PI and processed by PRTG to show how the progress of the production machine in manufacturing

A few weeks ago Paessler published on their blog an article I was part of that talked about a case study and implementation of how to use PRTG to real-time monitor a manufacturing machine / production machine while engaging a Raspberry PI.

The article describes what Dominik Wosiek and I implemented to monitor a manufacturing machine in real time. He started using a Raspberry PI and added eventually some magnetic field sensors to the machines robot arms to detect their movement. The data those sensor collected is interpreted by a script on the Raspberry PI and then send off to various HTTP push sensors on a free Paessler PRTG installation (we needed way less then 100 sensors and wanted to keep the installation independent).

On the PRTG instance, the data is of course collected and PRTG creates various graphs for us. We further added a PowerShell script that calculates the past time of the day. Due to us knowing the work-windows of the manufacturing department and how many parts are their daily target, we where able to use a Sensor Factory Sensor in PRTG to do some calculations and eventually show how the machine and the group controlling it was doing while comparing the output of parts relative to the time of the day – respective work hours past.

Above is an example configuration of the Sensor Factory Sensor in PRTG. We defined four channels:

  1. Production time passed in percent [%]
    1. this sensor pulls the passed time in minutes from the PowerShell Script sensor we created, it then does some math – the formula looks like this
      1. (passed minutes of the day – minutes passed when manufacturing starts) / (minutes passed when manufacturing ends – minutes passed when manufacturing starts) * 100 (to get percent)
      2. what it does in the example above:
        1. pull the passed minutes from the foreign sensor
        2. calculate 8 hours times 60 minutes (start of the day)
        3. subtract start time from passed time of the day (at 10 AM we would end up with 120 minutes)
        4. divide it with 17 hours times 60 or 5 PM in minutes of the day minus 8 AM minutes of the day – this gives you the total minutes between 8 AM and 5 PM – what is the defined manufacturing work time window
        5. multiply the result with 100 to get a percent value that shows the past time relative to the total work time window
  2. Part output vs. time [%]
    1. while the formula seems to be longer – it does nothing else then the using the same formula described in channel 4 minus the formula described in channel 2
    2. in other words – the value of part output in percent minus the value of work time passed in percent
    3. this results in either 0% – meaning the output is exactly at where they should be relative to the time past, or a negative number meaning the output is falling behind while a positive number would mean the part output is higher then expect relative to the time
      1. Note: this is all a bit relative, it might start negative in the morning, catch up to a positive number before lunch break, falling back to a negative number and then catching up to zero by the end of the day.. it depends on various factors but is a pretty good indicator
  3. Part output count
    1. this just loads the foreign channel of another sensor to show it in the same table/graph
  4. Part output in percent [%]
    1. while 25000 is the daily target amount of produced parts, this channel calculates how much of this was accomplished in percent while dividing the current count with the target count

Here is the script that I created to inject the minutes of the day in to a PRTG sensor – this is above used in channel(2323,2) within the formula.

Further details are described in the blog entry on the Paessler web site.

Windows Search Index monitoring

Windows Search Index monitoring

While rolling out Windows Search Indexing I bumped in to quite a few issues and things I wanted to monitor. One of the main information I actually was after is the amount of files in the Windows Search Index. I could see this information in the Indexing Options of the system and it was constantly updating, but I was not able to find the same information per WMI, PowerShell cmdlets, Performance Counters etc.

This caused me headache cause it was clear that the index a) had to grow till it reached a fully indexed system and b) if the index-size dropped below a certain amount (once finished) I surely had an issue – I saw the database rebuilding out of no where – due to pagefile-issues or space on the partition where the index-database resided.

All of this made it clear that monitoring was inherent – but I did not want to play around with EventIDs – clearly the amount of files in the index was a way better indicator.

This caused me to write the following PowerShell script – it will invoke a command to a target system and count the files currently in the index. This has to be invoked, though the OLEDB provider of the Search Index allows remote-requests, it does not give you accurate numbers for the overall scope of the index on the system using remote requests. Getting to a point to even get this information was quite a challenge, I am certain who ever finds this here will know already, assuming you did some research. Hope it helps, though.

An update to this or what I learned

Of course you wouldn’t just monitor the amount of indexed files with the script above. You likely have a dedicated drive / partition where the index resides. You definitive want to monitor the used or free drive space there as well. What you will discover especially in the beginning but as well later if many files are moved or copied to the server, is that the Windows Search Index database will grow after the indexing of huge amounts of files is done and shrink again. As far as I understand this, there is some maintenance and deduplication going on.

On a server with about 14 million files that took about 1 week to index, I ended up with a 250 GB index database, the second it finished it took another 12 hours while the database grew another 100 GB and then shrunk back to actually 200 GB.

Don’t let those numbers scare you, we talk about 10 TB (terra byte) of data in those 14 million files. This is quite a bit. Most other file servers won’t have such huge databases and you won’t see such huge increases while the index database is doing some kind of clean up, nor will it take a week for the initial index to finish.

What I wanted to show with this is simply that you really want to monitor all those information and keep a close eye on it. I saw the database make huge jumps in size in very very short periods of time. If the drive then is full your index possibly would get corrupted and Windows will start from zero again. You want to avoid this. Once the index is finished and no huge incoming file operations take place you won’t see to many jumps anymore. It will calm down. But still, always make sure you have enough space on the partition where the index database resides and proper monitoring on it to be able to react quickly (going as far as automating a service stop for the Windows Search index while the space goes down to avoid database corruption).

Monitor the total amount of sessions on your RDS farm

ins a website from a systems administrator for systems administrators Home IT-Admins CMDB IT-Admins tool IT Search EOL Solutions Blog Contact Links Monitor the total amount of sessions on your RDS farm

This script is designed for PRTG and will allow you to go through all your RDS hosts and result back the total amount of sessions and active sessions.

You have various options as server name source, see the parameter section on top of the script.

This was also posted here: https://kb.paessler.com/en/topic/83151-total-user-count-rds-windows-2016

Please note that I grabbed the original script and re-wrote it completely, adjust some issues I encountered and tried to make it as variable as possible.


VMware alert monitoring with PRTG and PowerShell

VMware alert monitoring with PRTG and PowerShell

There is a way to read out and process ALL alerts of your VMware environment using PowerShell and reporting the results back to PRTG. The script further down in this article does this. What you get is similar to the graphic here.

This show you the following channels:

  • Overall status
    • this will be green as long there aren’t any not acknowledged warnings or alerts in VMware
    • if the warning or alert is acknowledged, the sensor / script will return to green cause it is nothing that is new
  • Total Alerts – amount of alerts acknowledged and not ackowledged
  • Total Alerts – Acknowledged
  • Total Alerts – NOT Acknowledged
  • Total Warnings
  • Total Warnings – Acknowledged
  • Total Warnings – NOT Acknowledged
  • Total Warnings and Alerts
  • Total Warnings and Alerts – Acknowledged
  • Total Warnings and Alerts – NOT Acknowledged

As you can see – you can get more granular on your PRTG statuses if you use the channels for Warnings/Alerts that are acknowledged. You could set upper warning or error limits of 0 to keep a warning / error level in PRTG if you want to see them still.

While I was writing the script, I decided to create a new lookup value in PRTG to make it more clear. If you adjust the script in regards to add additional statuses for the channel overall status – you will need to adjust this file as well.

Let’s start with the value lookup file, you need to copy the text from the first script block in to a file you store here: C:\Program Files (x86)\PRTG Network Monitor\lookups\custom

Name the file: vmware.alerts.search.ovl

Now we need to create a custom EXE/XML sensor in this directory: C:\Program Files (x86)\PRTG Network Monitor\Custom Sensors\EXEXML

Name the file: VMwareAlerts.ps1

Once you have both files created, go to PRTG and add a new sensor called EXE/Script Advanced and select the new created script file. As Parameter you either type the host-name of your vSphere server or if you created it underneath the device in PRTG just use %host.

UPDATE: I changed the script cause I found it to be better to go with the following expected parameters and always making sure you have control over username and password used to connect to VMware. Please use the follow parameter moving forward:

There are still a few challenges you might need to overcome on top of this:

  • install the VMware PowerShell extensions on your PRTG probe server
  • credentials to connect to VMware can be a challenge as I tested this
    • you might need to have the service account of the PRTG probe have sufficient access rights – needs working SSO
    • alternative use a stored credentials file in PowerShell – somewhat secure
    • or provide the credentials clear text in PowerShell – least secure
    • please see line 20 respective the command “connect-viserver” for more details
  • updated the script – it now expects username and password as parameter

You might wanna test the script before you add a sensor to PRTG – the best way to do this is directly on the PRTG server with the service account of the PRTG probe to make sure it will work as a sensor later on.

Keep in mind that the script expects a parameter – the VMware vSphere server name / web-address.

This was also posted on the PRTG KB here.


Monitor multiple website certificates with a single PRTG sensor

Monitor multiple website certificates with a single PRTG sensor

Due to a request on the PRTG KB of someone needing a single sensor that monitors multiple URLs for their certificate expiration I came up with the following script that is posted on this PRTG KB as well. The modified PowerShell script was provided there – it is mentioned it sourced from Stack Overflow – I found it on this link: https://stackoverflow.com/questions/28386579/modifying-ssl-cert-check-powershell-script-to-loop-through-multiple-sites

The result would look like this:

To make it more usable – you can input parameters from PRTG like this:

or this for limits – warning 60 and error 10 – you could name them but this should work as well…

And here is the modified script:


Secured WinRM SSL session and PowerShell WinRM queries – example with a PRTG sensor for CPU, HDD and RAM

Secured WinRM SSL session and PowerShell WinRM queries – example with a PRTG sensor for CPU, HDD and RAM

Windows Mangement Remote Mangement / WinRM can be configured as HTTPS / encrypted connection instead of using clear text transfer of the provided information. In order to do this you need to configure it accordingly and have a valid machine certificate installed on the system.

Now – the advantage here is clearly the added security layer while you request and receive those information. More information on how to do this can be found here: https://support.microsoft.com/en-us/help/2019527/how-to-configure-winrm-for-https

Only it becomes a challenge when you want to use PowerShell and e.g. PRTG to use this HTTPS encrypted system. I came across this request and had to create a script that actually works with such an HTTPS encrypted SSL session to WinRM. You can find it below.

What it does is rather simple:

  • set the CimSessionOptions to use SSL
    • additionally it bypasses the certification checks by default – you might want to adjust this depending on your network configuration
  • it creates a new CimSession to your target system using the UseSSL option
  • and finally it executes a few queries against this session
  • the data in this example is then translated in to a PRTG compatible XML structure so you could use it in a Advanced EXE/XML sensor within PRTG

The data in this example combines information about the CPU(s), HardDrives / HDD(s) (only installed drives, not USB) and Memory usage to PRTG in a single sensor while using channels.

Due to some dynamic of the script, you want to make sure you have fixed upper and lower error limits on especially the channel Total Disks – so if something changes you can re-create the sensor due to it’s fixed channels once it did run the first time.

In theory you could provide limits within the XML response to PRTG – this is up to you – I always liked it more to configure them solely in PRTG in the sensor channels so I could adjust them per device.

PS: This was originally posted in the private PRTG channel on SpiceWorks here.

PRTG 911 call alerts – ShoreTel

PRTG 911 call alerts – ShoreTel

This is a PRTG 911 calls sensor script that I wrote a long time ago – it seems like there is quite some interest in it so I decided to write a blog post about it.

ShoreTel writes by default Windows Eventlog entries for 911 calls. The challenge we had is to inform HR / Human Resources and Facilities about such calls and let them know from which phone it was initiated.

While engaging PRTG we solved this while constantly checking for the specific Windows Eventlog EnventID 1319 in the Application log and raising an Error if the Event happened. We had to put a script in between and filter the event entry out to gather minimal data in the end for the event and notification that is send out to the specific HR and Facilities members.

First the script here:

Save the script in this path:

C:\Program Files (x86)\PRTG Network Monitor\Custom Sensors\EXE

Now add a custom EXE sensor (not the advanced) to PRTG and select the script. The expected parameters are the SERVERNAME and an INTERVAL – suggestions: SHORETELSERVER and 2 – 2 as interval assuming you scan every minute / 60 seconds / this will look for entries in the logfile within the last 120 seconds while accounting for any slack and keeping the error state alive for 2 to 3 minutes in PRTG.

Set the channel upper limit to 0 – if the script detects the Windows event you will get a 1 one back that indicates the error.

Set the scan-interval to 1 minute respective 60 seconds

Further might you want to add a special e-mail notification with the format TEXT WITH CUSTOM CONTENT and a target email recipient group for whom it concerns. See the screenshots below for some examples…

The email message body looks like this (example):

1 # (Value) is above the error limit of 0.90 # in Value (Emergency Services Call to 911 on port 10.10.10.10 from user ADDRESSBOOK NAME at 1234 (Extenstion))


Monitor multiple file sizes in one PRTG sensor

Monitor multiple file sizes in one PRTG sensor

The following script allows you to monitor multiple file sizes in one PRTG sensor. It expects you to determine the amount of files in the first parameter and add the correct amount of files as additional parameters.

E.g. – three files:

It of course wouldn’t mage much sense to monitor the example files, but that’s how you would give the parameters to this advanced exe/script sensor in PRTG. To test it, I recommend to use it via CSCRIPT in a DOS / CMD command window:

PRTG will see the file-name as channel name and the resulting file-size in byte per file you set up. Please be aware that you can’t just add additional channels later on – you could place dummy-files in the parameters to bypass this if ever needed.

Here is the VBS file that you need to place in to your PRTG installations advanced exe sensors directory:

This was as well posted in this PRTG article.