
Ever needed to run speed-tests between your VMware hosts? There is an CLI command iperf3 for this.
This command runs as a server and client command. One host will be the server and the other the client. There is further the possibility that some storage vendors even support the iperf3 command.
Example scenario with two VMware ESX hosts:
- IT-ESX-01P – will act as server
- IP: 10.0.0.1
- IT-ESX-02P – will act as client
- IP: 10.0.0.2
Steps and commands to execute the network speed test:
- Enable SSH on both hosts and connect with e.g. Putty to it, logon as well.
- IT-ESX-01P will act as our server
- disable the firewall
- esxcli network firewall set –enabled false
- The ESX firewall needs to be disabled temporarily to execute the tests – on client and server
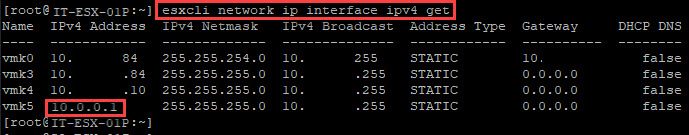
- List the kernel network IP addresses
- esxcli network ip interface ipv4 get


- choose the interface IP that is on the network you want to test, only kernel-IPs will work
- esxcli network ip interface ipv4 get
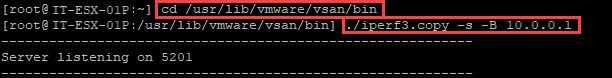
- go to the directory that holds the iperf3 command
- cd /usr/lib/vmware/vsan/bin
- start the iperf server on this host on the kernel IP you need it on
- ./iperf3.copy -s -B 10.0.0.1


- this command starts the server respective listener on the host on the specified IP address
- ./iperf3.copy -s -B 10.0.0.1
- disable the firewall
- IT-ESX-02P will act as our client
- disable the firewall
- esxcli network firewall set –enabled false
- The ESX firewall needs to be disabled temporarily to execute the tests – on client and server
- go to the directory that holds the iperf3 command
- cd /usr/lib/vmware/vsan/bin
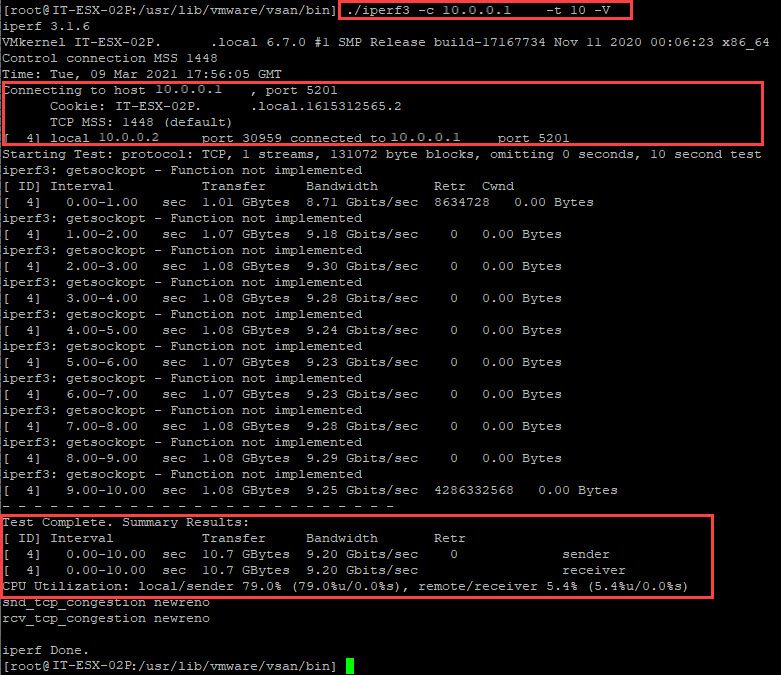
- execute the speed test against the server IP address
- ./iperf3 -c 10.0.0.1 -t 10 -V


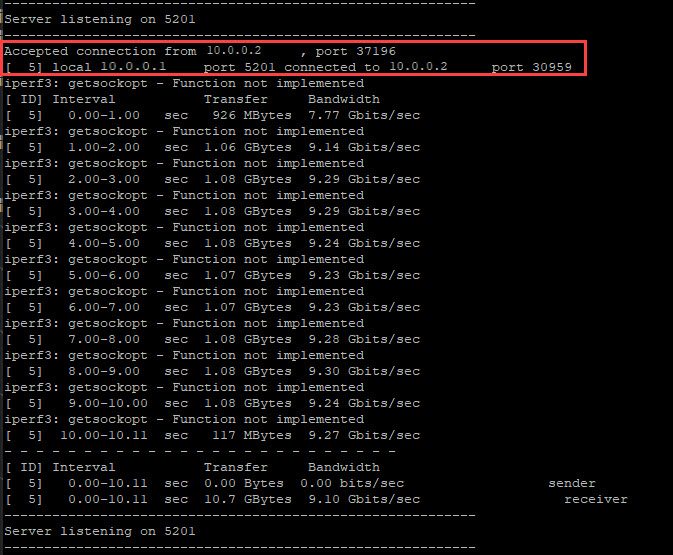
- this will start sending packets to the server – you will see the flow on both sides


- cancelling this command – cntrl + c – can take a minute, be patient, especially if you mistyped the IP or forgot to disable the firewall etc..
- ./iperf3 -c 10.0.0.1 -t 10 -V
- disable the firewall
- Review the results on the speed test
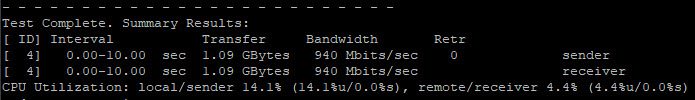
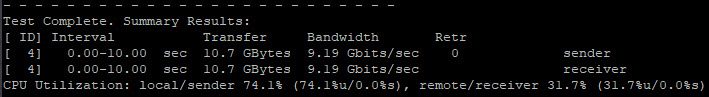
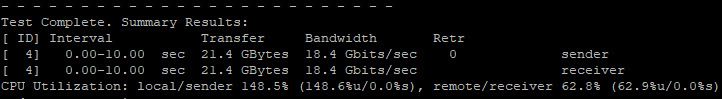
- Below are result samples for a 1 GB kernel network, a 10 GB kernel network and a 25 GB kernel network.
- Sample results – 1 GB


- Sample results – 10 GB


- Sample results – 25 GB


- Be aware, those results will vary and depend on the network bandwidth available in the moment of the test, respective the current load on the network cards of client and server.
- IT-ESX-01P exit server mode and enable firewall
- cntrl + c will exit the server mode and go back to the CLI
- enable the firewall
- esxcli network firewall set –enabled true
- EXIT SSH
- IT-ESX-02P enable firewall
- enable the firewall
- esxcli network firewall set –enabled true
- EXIT SSH
- enable the firewall
- Done
Additional links to this topic:
- ESXi Network Troubleshooting Tools – VMware vSphere Blog
- Iperf – Wikipedia
- iPerf – The TCP, UDP and SCTP network bandwidth measurement tool

