There is a way to read out and process ALL alerts of your VMware environment using PowerShell and reporting the results back to PRTG. The script further down in this article does this. What you get is similar to the graphic here.
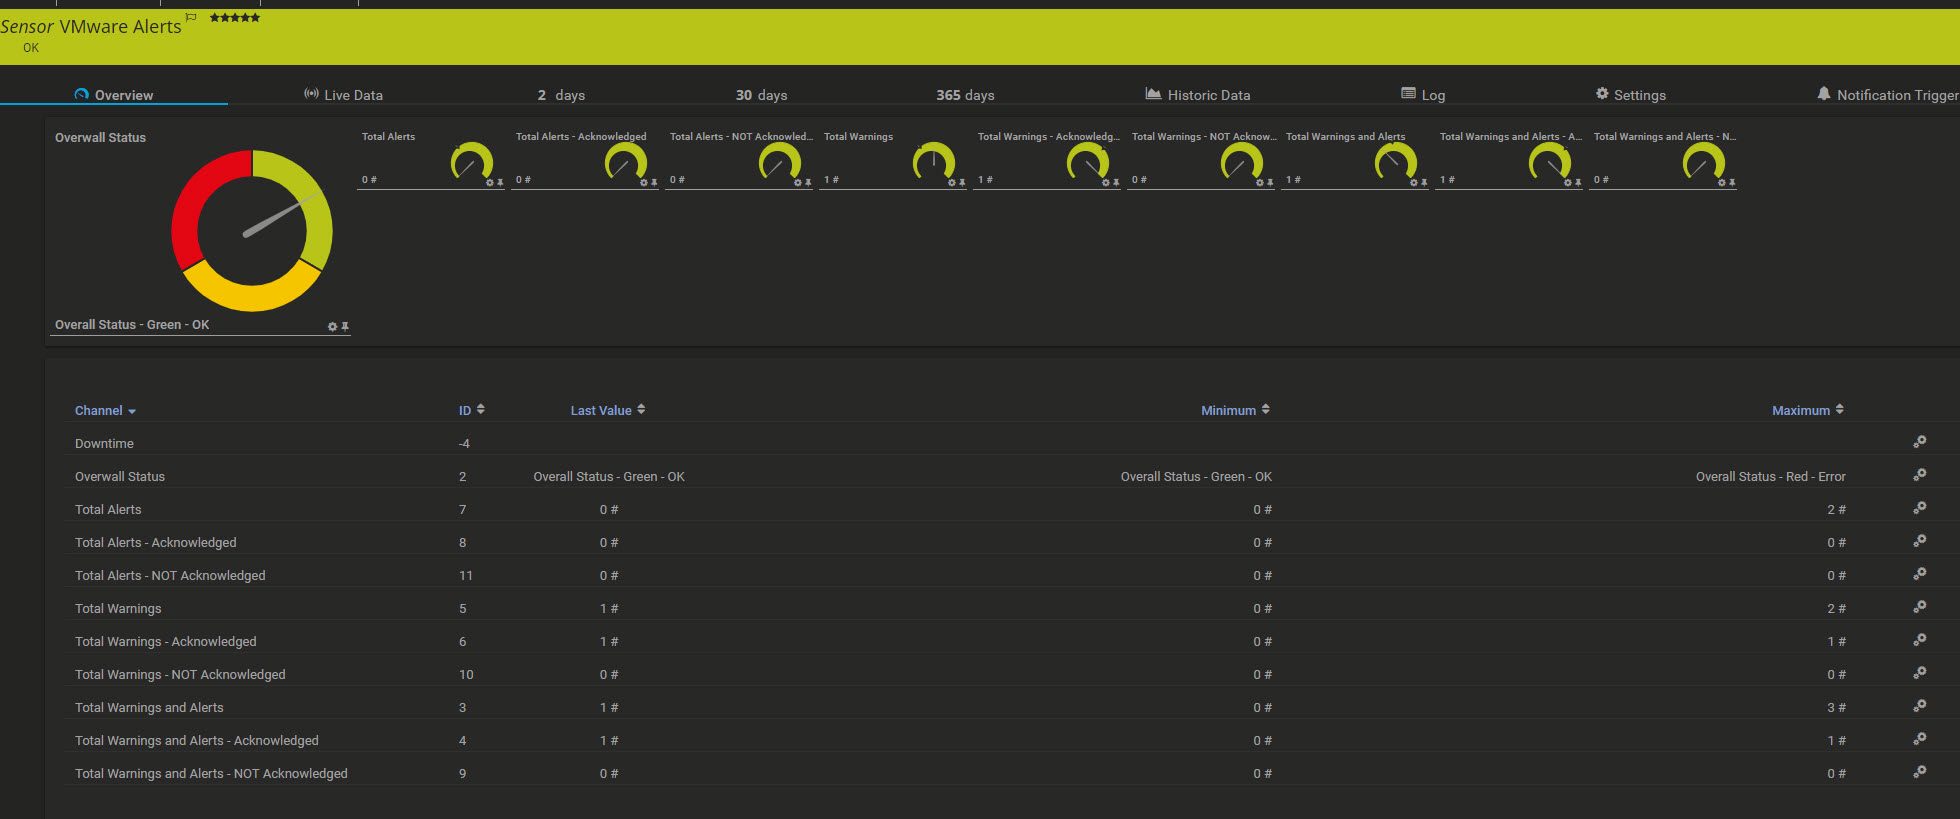
This show you the following channels:
- Overall status
- this will be green as long there aren’t any not acknowledged warnings or alerts in VMware
- if the warning or alert is acknowledged, the sensor / script will return to green cause it is nothing that is new
- Total Alerts – amount of alerts acknowledged and not ackowledged
- Total Alerts – Acknowledged
- Total Alerts – NOT Acknowledged
- Total Warnings
- Total Warnings – Acknowledged
- Total Warnings – NOT Acknowledged
- Total Warnings and Alerts
- Total Warnings and Alerts – Acknowledged
- Total Warnings and Alerts – NOT Acknowledged
As you can see – you can get more granular on your PRTG statuses if you use the channels for Warnings/Alerts that are acknowledged. You could set upper warning or error limits of 0 to keep a warning / error level in PRTG if you want to see them still.
While I was writing the script, I decided to create a new lookup value in PRTG to make it more clear. If you adjust the script in regards to add additional statuses for the channel overall status – you will need to adjust this file as well.
Let’s start with the value lookup file, you need to copy the text from the first script block in to a file you store here: C:\Program Files (x86)\PRTG Network Monitor\lookups\custom
Name the file: vmware.alerts.search.ovl
1 2 3 4 5 6 7 8 | <?xml version="1.0" encoding="utf-8"?> <ValueLookup id="vmware.alerts.search" desiredValue="0" xmlns:xsi="http://www.w3.org/2001/XMLSchema-instance" xsi:noNamespaceSchemaLocation="PaeValueLookup.xsd" undefinedState="Warning"> <Lookups> <SingleInt state="Ok" value="0">Overall Status - Green - OK</SingleInt> <SingleInt state="Warning" value="1">Overall Status - Yellow - Warning</SingleInt> <SingleInt state="Error" value="2">Overall Status - Red - Error</SingleInt> </Lookups> </ValueLookup> |
Now we need to create a custom EXE/XML sensor in this directory: C:\Program Files (x86)\PRTG Network Monitor\Custom Sensors\EXEXML
Name the file: VMwareAlerts.ps1
1 2 3 4 5 6 7 8 9 10 11 12 13 14 15 16 17 18 19 20 21 22 23 24 25 26 27 28 29 30 31 32 33 34 35 36 37 38 39 40 41 42 43 44 45 46 47 48 49 50 51 52 53 54 55 56 57 58 59 60 61 62 63 64 65 66 67 68 69 70 71 72 73 74 75 76 77 78 79 80 81 82 83 84 | #make sure the executing user and system has those two commands run #Find-Module -Name VMware.PowerCLI #Install-Module -Name VMware.PowerCLI #useful command #Set-PowerCLIConfiguration -Scope User -ParticipateInCEIP:$false -confirm:$false #Set-PowerCLIConfiguration -InvalidCertificateAction ignore -confirm:$false # #alternative look here: https://blogs.vmware.com/PowerCLI/2017/04/powercli-install-process-powershell-gallery.html param( [string] $VCenterServer = "", [string] $DomainAndUser = "", [string] $Password = "" ) Import-Module VMware.PowerCLI #avoid unecessary output Set-PowerCLIConfiguration -Scope User -ParticipateInCEIP:$false -confirm:$false #avoid certificate issues Set-PowerCLIConfiguration -InvalidCertificateAction ignore -confirm:$false Connect-VIServer $VCenterServer -username "$DomainAndUser" -Password "$Password" $colAlarms = (Get-DataCenter).ExtensionData.TriggeredAlarmState $XML = "<PRTG>" [int] $Warnings = 0 [int] $WarningsAck = 0 [int] $Alerts = 0 [int] $AlertsAck = 0 [int] $OverallStatus = 0 #default green if ($colAlarms.Count -gt 0) { foreach ($entry in $colAlarms) { if ($entry.OverallStatus -eq "yellow") { $Warnings += 1 if ($entry.Acknowledged) { $WarningsAck =+ 1 } else { #we only increase the overall status if this alert is not acknowledged if ($OverallStatus -lt 1) { $OverallStatus = 1 } } } elseif ($entry.OverallStatus -eq "red") { $Alerts += 1 if ($entry.Acknowledged) { $AlertsAck =+ 1 } else { #we only increase the overall status if this alert is not acknowledged if ($OverallStatus -lt 2) { $OverallStatus = 2 } } } } } $XML += "<result><channel>Overwall Status</channel><value>" + $OverallStatus + "</value><ValueLookup>vmware.alerts.search</ValueLookup></result>" $XML += "<result><channel>Total Warnings and Alerts</channel><value>" + $colAlarms.Count + "</value><CustomUnit>#</CustomUnit></result>" $XML += "<result><channel>Total Warnings and Alerts - NOT Acknowledged</channel><value>" + ($colAlarms.Count - $WarningsAck + $AlertsAck) + "</value><CustomUnit>#</CustomUnit></result>" $XML += "<result><channel>Total Warnings and Alerts - Acknowledged</channel><value>" + ($WarningsAck + $AlertsAck) + "</value><CustomUnit>#</CustomUnit></result>" $XML += "<result><channel>Total Warnings</channel><value>" + $Warnings + "</value><CustomUnit>#</CustomUnit></result>" $XML += "<result><channel>Total Warnings - NOT Acknowledged</channel><value>" + ($Warnings - $WarningsAck) + "</value><CustomUnit>#</CustomUnit></result>" $XML += "<result><channel>Total Warnings - Acknowledged</channel><value>" + $WarningsAck + "</value><CustomUnit>#</CustomUnit></result>" $XML += "<result><channel>Total Alerts</channel><value>" + $Alerts + "</value><CustomUnit>#</CustomUnit></result>" $XML += "<result><channel>Total Alerts - NOT Acknowledged</channel><value>" + ($Alerts - $AlertsAck) + "</value><CustomUnit>#</CustomUnit></result>" $XML += "<result><channel>Total Alerts - Acknowledged</channel><value>" + $AlertsAck + "</value><CustomUnit>#</CustomUnit></result>" $XML += "</PRTG>" Function WriteXmlToScreen ([xml]$xml) #just to make it clean XML code... { $StringWriter = New-Object System.IO.StringWriter; $XmlWriter = New-Object System.Xml.XmlTextWriter $StringWriter; $XmlWriter.Formatting = "indented"; $xml.WriteTo($XmlWriter); $XmlWriter.Flush(); $StringWriter.Flush(); Write-Output $StringWriter.ToString(); } #Clear WriteXmlToScreen "$XML" |
Once you have both files created, go to PRTG and add a new sensor called EXE/Script Advanced and select the new created script file. As Parameter you either type the host-name of your vSphere server or if you created it underneath the device in PRTG just use %host.
UPDATE: I changed the script cause I found it to be better to go with the following expected parameters and always making sure you have control over username and password used to connect to VMware. Please use the follow parameter moving forward:
1 | <strong>%host "%windowsdomain\%windowsuser" "%windowspassword"</strong> |
There are still a few challenges you might need to overcome on top of this:
- install the VMware PowerShell extensions on your PRTG probe server
- in a PowerShell execute
- Find-Module -Name VMware.PowerCLI
- Install-Module -Name VMware.PowerCLI
- alternative use the documentation mentioned in the next link
- in a PowerShell execute
credentials to connect to VMware can be a challenge as I tested thisyou might need to have the service account of the PRTG probe have sufficient access rights – needs working SSOalternative use a stored credentials file in PowerShell – somewhat secureor provide the credentials clear text in PowerShell – least secureplease see line 20 respective the command “connect-viserver” for more details
- updated the script – it now expects username and password as parameter
You might wanna test the script before you add a sensor to PRTG – the best way to do this is directly on the PRTG server with the service account of the PRTG probe to make sure it will work as a sensor later on.
Keep in mind that the script expects a parameter – the VMware vSphere server name / web-address.
This was also posted on the PRTG KB here.


