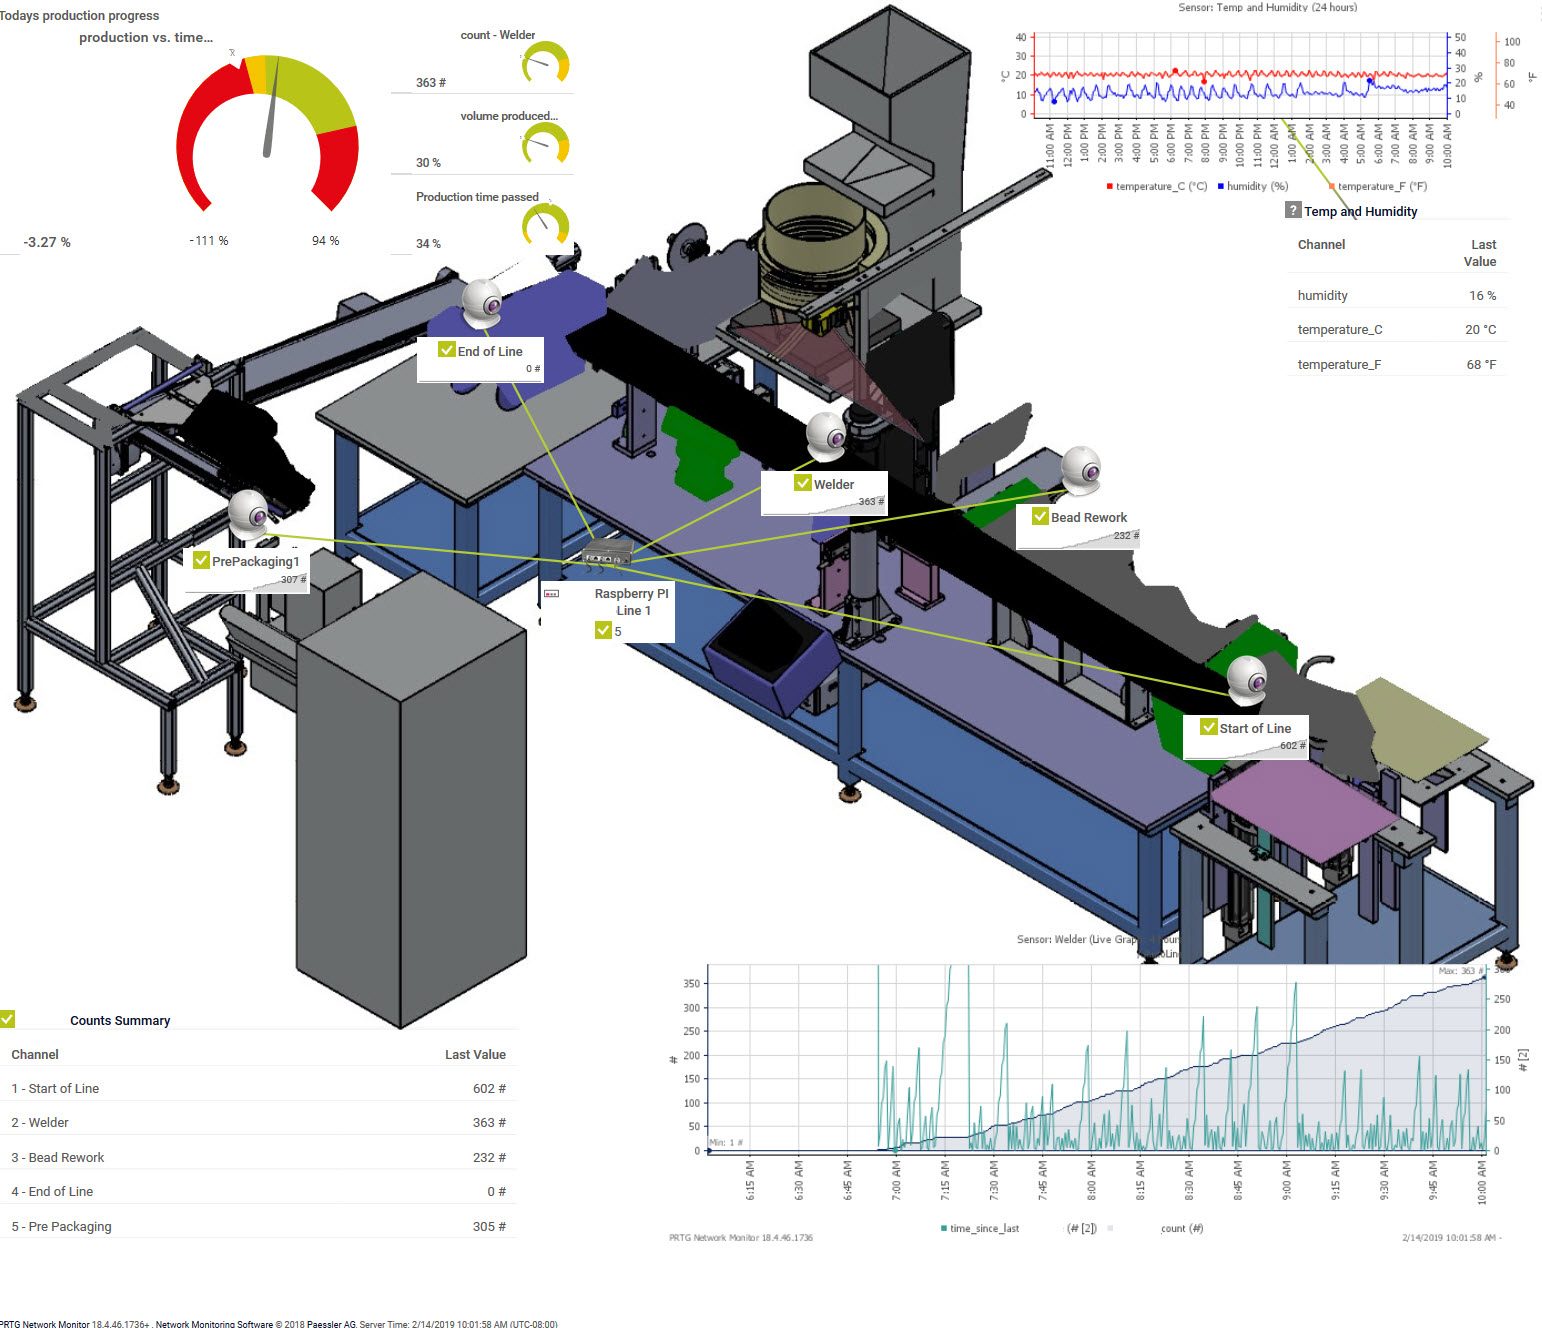
This is a screenshot of the real-time data map of the PRTG instance that is used to monitor the data collected by the Raspberry PI and processed by PRTG to show how the progress of the production machine in manufacturing
A few weeks ago Paessler published on their blog an article I was part of that talked about a case study and implementation of how to use PRTG to real-time monitor a manufacturing machine / production machine while engaging a Raspberry PI.
The article describes what Dominik Wosiek and I implemented to monitor a manufacturing machine in real time. He started using a Raspberry PI and added eventually some magnetic field sensors to the machines robot arms to detect their movement. The data those sensor collected is interpreted by a script on the Raspberry PI and then send off to various HTTP push sensors on a free Paessler PRTG installation (we needed way less then 100 sensors and wanted to keep the installation independent).
On the PRTG instance, the data is of course collected and PRTG creates various graphs for us. We further added a PowerShell script that calculates the past time of the day. Due to us knowing the work-windows of the manufacturing department and how many parts are their daily target, we where able to use a Sensor Factory Sensor in PRTG to do some calculations and eventually show how the machine and the group controlling it was doing while comparing the output of parts relative to the time of the day – respective work hours past.
1 2 3 4 5 6 7 8 | #1:Production time passed in percent [%] ((channel(2323,2) - (8 * 60)) / (17 * 60 - 8 * 60) * 100) #2:Part output vs. time [%] (channel(3232,2)/25000*100) - ((channel(2323,2) - (7 * 60)) / (16 * 60 - 7 * 60) * 100) #3:Part output count channel(3232,2) #4:Part output in percent [%] (channel(3232,2)/25000*100) |
Above is an example configuration of the Sensor Factory Sensor in PRTG. We defined four channels:
- Production time passed in percent [%]
- this sensor pulls the passed time in minutes from the PowerShell Script sensor we created, it then does some math – the formula looks like this
- (passed minutes of the day – minutes passed when manufacturing starts) / (minutes passed when manufacturing ends – minutes passed when manufacturing starts) * 100 (to get percent)
- what it does in the example above:
- pull the passed minutes from the foreign sensor
- calculate 8 hours times 60 minutes (start of the day)
- subtract start time from passed time of the day (at 10 AM we would end up with 120 minutes)
- divide it with 17 hours times 60 or 5 PM in minutes of the day minus 8 AM minutes of the day – this gives you the total minutes between 8 AM and 5 PM – what is the defined manufacturing work time window
- multiply the result with 100 to get a percent value that shows the past time relative to the total work time window
- this sensor pulls the passed time in minutes from the PowerShell Script sensor we created, it then does some math – the formula looks like this
- Part output vs. time [%]
- while the formula seems to be longer – it does nothing else then the using the same formula described in channel 4 minus the formula described in channel 2
- in other words – the value of part output in percent minus the value of work time passed in percent
- this results in either 0% – meaning the output is exactly at where they should be relative to the time past, or a negative number meaning the output is falling behind while a positive number would mean the part output is higher then expect relative to the time
- Note: this is all a bit relative, it might start negative in the morning, catch up to a positive number before lunch break, falling back to a negative number and then catching up to zero by the end of the day.. it depends on various factors but is a pretty good indicator
- Part output count
- this just loads the foreign channel of another sensor to show it in the same table/graph
- Part output in percent [%]
- while 25000 is the daily target amount of produced parts, this channel calculates how much of this was accomplished in percent while dividing the current count with the target count
Here is the script that I created to inject the minutes of the day in to a PRTG sensor – this is above used in channel(2323,2) within the formula.
1 2 3 4 5 6 7 8 9 10 11 12 13 14 15 16 17 18 19 20 21 22 23 24 25 26 | $CurrentTime = Get-Date -UFormat %R $CurrentHours = [int]$CurrentTime.ToString().Split(":")[0] $CurrentMinutes = [int]$CurrentTime.ToString().Split(":")[1] $MinutesToday = $CurrentMinutes + ($CurrentHours * 60) $XML = " <prtg> <result> <channel>Current Minutes Today</channel> <value>$MinutesToday</value> </result> </prtg> " Function WriteXmlToScreen ([xml]$xml) #just to make it clean XML code... { $StringWriter = New-Object System.IO.StringWriter; $XmlWriter = New-Object System.Xml.XmlTextWriter $StringWriter; $XmlWriter.Formatting = "indented"; $xml.WriteTo($XmlWriter); $XmlWriter.Flush(); $StringWriter.Flush(); Write-Output $StringWriter.ToString(); } WriteXmlToScreen "$XML" |
Further details are described in the blog entry on the Paessler web site.

