monitoring

Monitor user accounts in Active Directory with PRTG

Monitor user accounts in Active Directory with PRTG

The following script will read through your current Active Directory and filter for user accounts with the following specific conditions:

  • Lockedout users – please read below for further information about this
    • all users that are lockedout
    • must be an enabled user
    • that is not expired
  • disabled users
    • all users that have been disabled
  • expired users
    • must be an enabled user
    • the expiration date is set and past the current date
  • users with password never expires set
    • must be an enabled user

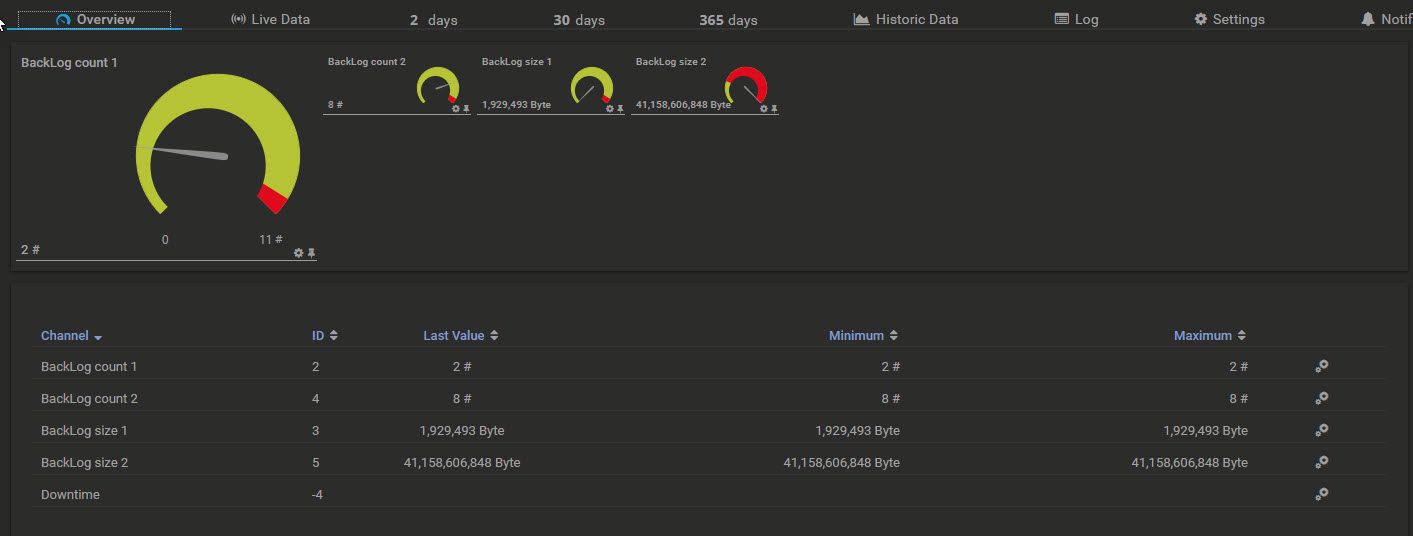
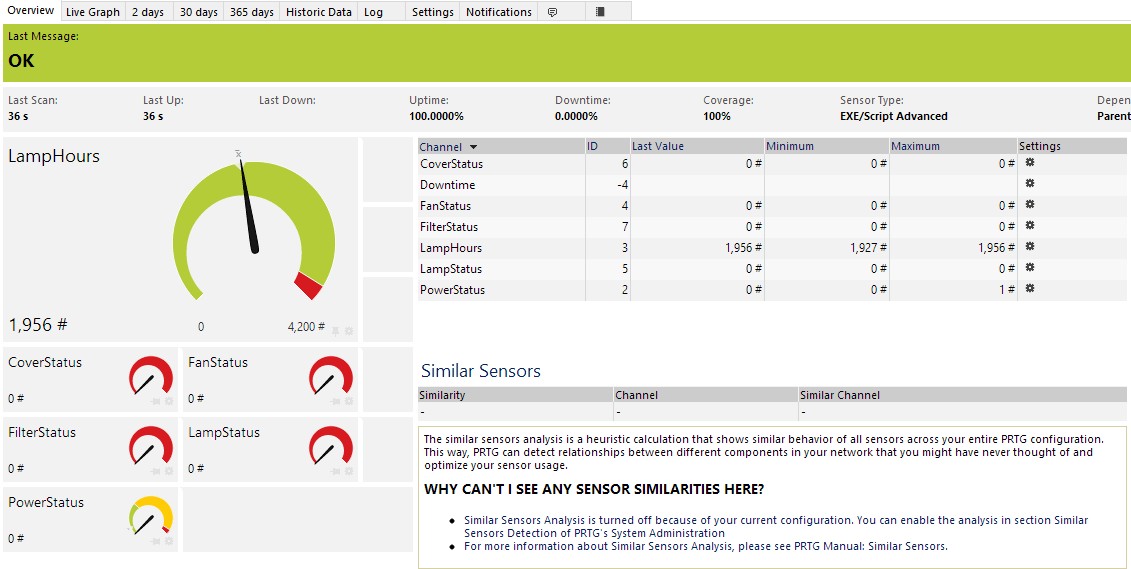
This will give you a pure counter output per channel in an for PRTG Extended script sensor XML result.

But there is a theoretical flaw in one of the methods – the locked out users. Now, user accounts get locked out in Active Directory due to too many logon attempts with an invalid password. This causes Active Directory to set the lockedout bit in the object properties. The issue here is that this bit will not be set back to 0 after the defined lockout duration (GPO) is past, the property will only be set back to 0 once the lockout duration is passed and he successfully logged on.

This means, the counter might give you more results then currently true, it might count users that have been locked out but the lockout-duration passed – but they did not yet logon successfully. This is somehow a false positive, while not totally false. In any case, you need to be aware of this.

The script could be more efficient as well in the way it filters a few things, so far I optimized it as far as I could – the LockedOut value can not be set as a -Filter, in theory it might be possible to speed it up with a -Filter to the UserAccountControl (if that is even possible – not tested) – but I am not certain this would work. If you really want to speed it up you would need to work with -LDAPFilter – but this actually needs to completely replace the internal filter capabilities of Get-ADUser – you can’t use both – it is one or the other.

This script updated with a corrected version as of February 2019 and was also posted in the PRTG knowledge base here.

Monitor DFS replication backlog between servers in PRTG

Monitor DFS replication backlog between servers in PRTG

One of the challenges with DFS is to monitor the DFS replication backlog. There are various scripts out there to accomplish this. Unfortunately I found nothing I really liked and giving me the simple insight I wanted.

The goal was simple – a script that will monitor the backlog between two systems in both directions – meaning Server-A to Server-B and Server-B to Server-A. For both directions I wanted to see the amount of files as well as the size of those files. I did not care about what DFS groups and or DFS folders are affected in detail – this is because the amount of groups might change, the amount of folders will likely change rather frequently, meaning it would be a challenge to monitor it per group or even on a folder level very efficient. Monitoring the amounts of groups and folders alone has no really advantage, cause this would have been changed by an administrator.

Below you will find my script that actually expects three parameter – the two server names and a limit integer value. The limit will not influence the XML response of the script, you could add the <text>$Response</text> and <text>$Response2</text> tags in lines 77 and 79 after the </unit> and before the </result> tag if you want, I removed them currently.

See the picture below as an example of how the result looks like in PRTG.

Create the following script in C:\Program Files (x86)\PRTG Network Monitor\Custom Sensors\EXEXML and make sure you have the C:\Windows\system32\WindowsPowerShell\v1.0\Modules\Dfsr\ and the C:\Windows\SysWow64\WindowsPowerShell\v1.0\Modules\Dfsr\ folders – you might need to copy them over. If you miss them at all, you might need to add the needed Windows Roles/Features or install the RSAT (Remote Server Administration Tools) on your system.

Monitoring Shadow-Copies with PRTG

Monitoring Shadow-Copies with PRTG

This was originally posted here by myself: https://kb.paessler.com/en/topic/65026-monitor-shadow-copies-age#reply-247626

This is my solution for it – we monitor specific drives we enabled for shadow copy and wanted to see amount of shadows, newest should be within x hours and oldest should be at a minimum n hours – those limits can be configured with the limitations rather easily.

Main issue is – we talk about WMI modules that are only available in x64 if you use a x64 system. Now PRTG is executing sensors in x86, even thought it is installed on x64. Now, played around a while and came up with this simple solution.

Parameters for the parser-script (the one you need to execute) are: %host C: %host D: etc.

Parser script, needs to be in EXEXML directory: Name: Get-ShadowCopyStatsXMLx64parser.cmd

PS1 script, should to be in EXEXML directory – if not, adjust path in parser script: Name: Get-ShadowCopyStatsXML.ps1

PS: yes, the PS1 could be further optimized, but it took me already a while to find out the main issue was the x86/x64 combination, what is not possible – see Microsoft articles in MSDN/KB for more information while the Shadow-Copy WMI modules are only available in x64 on a x64 system.

Hope this helps others with the same challenge 🙂

PRTG – Veritas Backup Exec monitoring

This was originally posted by myself here: https://kb.paessler.com/en/topic/58233-symantec-backupexec-monitoring#reply-262024

We monitor backups a little bit more advanced – I thought I should share this knowledge as well…

Single Job Monitoring: Monitor a single job and it’s results – allows you configure the Job-Name with a PRTG filter value in the SQL sensor. The results will include various values – most notable are:

  • FinalJobStatus (as text)
  • TotalDataSizeBytes
  • TotalNumberOfDirectories
  • TotalNumberOfFiles
  • TotalRateMBMin

In order to implement this sensor, add a SQLv2 Sensor and configure like this:

  • Database: BEDB
  • Instance Name: BKUPEXEC (in most cases)
  • Use input parameter: specify the exact job name
  • DBNull = Error

Channels: Most channels are rather simple to configure, they are counters, SpeedDisk or BytesDisk – as PRTG has those channel types integrated already. The special channel is FINALJOBSTATUS – in order to have this working you will need the “backupexec.jobstatus.ovl” file in your %programfilesx86%\PRTG…\Lookups directory – see below for the file.

SQL Script for single job monitoring:

The backupexec.jobstatus.ovl file:

Another SQL script we use is the one below – this actually approaches the whole monitoring more in an overview – it still depends on the JobHistory table, meaning, the job must have been running.. in theory you could work around this and actually get information on the scheduler etc.. the script below is a pure example.

Finally I wanted to mention what are our real challenges are, and we don’t yet have a really good solution: Our backup runs FULL starting Friday evening… during the week we run incremental backups. Now the incremental backups are not as critical… so let’s focus on the weekends.

What happened every now and then was that e.g. only a few tapes where write able and other might still have been locked or one of our libraries jammed etc..

In the end, it means – we e.g. came in Monday morning and discovered that 50+ % of the backups did not run.

Now, the question is, how do you monitor this. There are about a 150 jobs – they are stacked on each other. In theory I expect let say 5 running jobs, 0 completed and a 145 pending – starting Friday night – over the weekend this number will change constantly.

What I did not yet find is that a good solution that when Backup Exec waits for user interaction like insert tapes, offline library, etc. does wait for user interaction.

As well as the fact that I can’t tell PRTG on Friday I expect e.g. 150 jobs pending, on Saturday 1 PM the number should be more like 75 jobs pending and on Sunday 6 AM is should be down to 50 pending and Sunday 8 PM it should be 0 pending and 150 successful.

This is very granular, making it hard to find a solution. The jobs in our case will not finish – they are within their weekend time-window and will not be auto cancelled and therefor only manually looking in to Backup Exec will tell you if we are making progress or not.

It could be a solution to constantly see if the Total Bytes backed up goes up – but this again is challenging, we would need to compare values over time.. PRTG is as far as I know not directly able to do so and this would mean we would need to have a temp file with values form the last check in some kind of script or database that we would compare too…

So far I did not come up with the ultimate solution – every now and then I think about it a little more.. but well, I am not there yet.

Advanced PRTG Slack notifitications

Advanced PRTG Slack notifitications

This PRTG slack notification script was originally posted by myself here: https://kb.paessler.com/en/topic/66113-how-can-prtg-send-notifications-to-slack#reply-249147

This is our version of the script originally provided with PRTG by Paessler. – we are using the #colorstatus as well to determine to current issue and we are using actually icons to show the status – this is working pretty well for us. Besides that, reformatted the whole notification a bit so it is easier to read in the prtg slack notification messages.

Simple Slack example

It is easy to adjust and even use additional statuses/color-codes if needed..

Monitor your projectors and light bulbs with PJLink

Monitor your projectors and light bulbs with PJLink

Below is a solution rather than a question. Just thought I share it with the rest of the Paessler/PRTG world. This was originally posted here by myself: https://kb.paessler.com/en/topic/76639-monitor-your-projectors-and-light-bulbs-with-pjlink

Our challenge:

Projectors are having issues “out of now where” and of course always urgent – IT department didn’t have monitoring on it. Of course, normally you already have a conference going on or it is urgent and the projector might be really down already – most likely due to an end of life light bulb.

What we have:

NEC and Optima projectors – with Ethernet interfaces

Research and work:

We found out that there is a PJLink protocol (http://pjlink.jbmia.or.jp/english/index.html) that is supported by those devices. A little more research and we found a library on GitHub for Visual Studio (C#) (https://github.com/uow-dmurrell/ProjectorControl). We took it, modified the LAMPHOURS so we could get it public (only one lamp for now – but we only have projectors with one lamp). Modified the TEST-Project that comes with it to accept IP addresses as parameter and modified the output in to a PRTG XML format. Further modified the output so it is numeric. (We are not aware that any of that stuff is copyright protected, if so – we apologize and will stop using those components)

Result:

We added a PRTG sensor based on XML data that monitors (advanced EXE/XML) with the IP of the device as parameter and get the following information:

  • LampHours – we set ours to max. 4000 as error level
  • CoverStatus (0 OK / 1 ERROR)
  • FanStatus (0 OK / 1 ERROR)
  • FilterStatus (0 OK / 1 ERROR)
  • LampStatus (0 OK / 1 ERROR)
  • PowerStatus (0 off / 1 on = OK 2 cool down / 3 warm up = WARNING (we don’t get alerts there) 4 unknown = ERROR)

This actually helps us to keep an as close as possible eye on the projectors and being proactive if something is already reported as defect and the LampHours (adjustable, depending on manufacturer/model) are coming close to an issue, so we are ready for it.

Code changes:

ProjectorInfo.cs – added this:

Program.cs (or create your own project)

SQL Database backup monitoring

SQL Database backup monitoring

The following article was originally posted here by myself: https://kb.paessler.com/en/topic/79665-sql-database-backup-monitoring

SQL backups and their monitoring is one of the most important things. We often talk about rather complex situations including transaction-logfiles and various other stuff.

Monitoring those things was something that did cost us to many sensors with the standard-scripts etc. and was not really effective.

In order to change this – here are two scripts that will be able to solve most of your issues – you find them both at the end of this posting:

  • SQLBackupDestinationCheck.vbs
  • SQL_Database_Full_Backups.sql

SQLBackupDestinationCheck.vbs: This is a VBS script that will return XML content to Paessler/PRTG in multiple channels while using one sensor.

It expects three parameters:

  • go through first level sub folders: 0 (no) or 1 (yes)
  • file extension to obey – any other extension will be ignored – in most cases: “bak”
  • Path – should mostly be an UNC path

It will return those channels:

  • Total file count: count of all files with this extension in all folders checked
  • Total folder count: count of all folders checked
  • Oldest file found in days: oldest file – value gives back age in days
  • Newest file found in days: newest file – value gives back age in days
  • Lowest files in folder count found: lowest count of files that have been found in one folder
  • Highest files in folder count found: max. files that have been found in one folder

This needs some explanation:
The script checks a path for files with a certain extension. Let’s say you do SQL maintenance plans and use the extension .BAK to write those. You do a daily backup and keep them for 3 days to make sure they end up on a tape, further do you use sub-folders per database and you have a total of 5 databases on this system – now you will need to configure error-limits per channel – e.g.:

  • Total file count: lower limit: 10 files – upper limit: 20 files – during the backup you might have up to 20 files
  • Total folder count: 5 folders upper and lower limit – more/less then 5 would mean something changed
  • Oldest file found in days: lower limit 2 days – upper limit 4 days – older then 4 would mean the cleanup does not work
  • Newest file found in days: lower limit 0 days – upper limit 2 days – nothing newer (date issues? and nothing older as well)
  • Lowest files in folder count found: lower limit: 2 – there should be always more then 2x .BAK files in any subfolder
  • Highest files in folder count found: upper limit: 4 – anything above again would mean some clean up is not working right for one database

So – keep in mind – you can get more fancy with WARNING limits and ERROR limits – the example above will help you understand what to do – this should help you getting started. The script will save you quite a few sensors and still keep a pretty close watch on the file-system side of SQL backups – of course you could abuse it for something else then SQL backups as well – but this was my main intent for this script.
SQL_Database_Full_Backups.sql
This file will request information about backups for SQL itself. It might need a SQL 2005 or newer to work – and yes – I did post this on another PRTG KB thread – but I wanted to have the complete solution in this one post.

The script will be executed against the SQL server instance the databases reside, on the master-database. You need to specify a parameter that will be set as “@MaxHours” – this actually should be something like 26 hours, so your SQL backups are never exciting 26 hours – giving the backup some time to run as well. More for bigger databases might be necessary. If you do multiple full-backups per day, set it to e.g. 2 hours or what ever your limit is.

You will get backup 3x columns:

TotalAmountOfDatabasesTotal amount of databases of this server – this allows you not only to watch if anyone created/deleted a database on the server, it also gives you a good base-line in general
RecentlyBackupUpCounHow many databases have been backed up recently – full backup – in specified time-window
NOTRecentlyBackupUpCountHow many have not been backed up in the same time window

RecentlyBackupUpCount and NOTRecentlyBackupUpCount should always match up to TotalAmountOfDatabases – but that’s not the point. More important is – you might have backed up databases and not backed up databases – set you error-limits for all three columns accordingly – upper and lower limit – and you will see that the alert will fire if you add a database or keep the SQL agent service stopped so it hops over a single backup and misses it…

Folder: C:\Program Files (x86)\PRTG Network Monitor\Custom Sensors\EXEXML
File: SQLBackupDestinationCheck.vbs

Folder: C:\Program Files (x86)\PRTG Network Monitor\Custom Sensors\sql\mssql
File: SQL_Database_Full_Backups.sql

Using PowerShell for Text-to-Speech

Using PowerShell for Text-to-Speech

PowerShell can be used for TTS / Text-to-Speech. In this specific example, PowerShell will be used for Paessler/PRTG (www.paessler.com) text-to-speech notifications. It will actually run against a remote-system in this scenario in a central NOC/Network Operations Center room and announce down sensors/systems. This was originally posted by myself on https://kb.paessler.com/en/topic/79674-can-we-have-the-ability-to-set-audio-notifications-when-sensors-go-down-up.

You simply create the script in the path C:\Program Files (x86)\PRTG Network Monitor\Notifications\EXE and create a new notification for it.

The parameters should be configured like this:

-TargetComputer ‘COMPUTER123’ -Device ‘%device’ -Name ‘%name’ -Status ‘%status’ -Message ‘%message’

Replace the COMPUTER123 with what ever client should play the sound – in our case this is the workstation that shows the MAPs on a TV and the sound actually comes out of the TV.

You might need to enable remote power shell execution on the target system, a hint for this is the following command: Enable-PSRemoting -Force

Here is the script file: Name: PRTGtoWorkstationText2Speach.ps1